Saturday, December 30, 2023

Factor Analysis of Multi collinear variables in Economics

Factor Analysis is a statistical procedure used to classify the functional form of relationships between several variables and narrow it down to a smaller set of variables. If there are many variables, and they are linearly correlated, factor analysis tries to club highly correlated variables together as a latent variable called factors. The number of factors defining all variables in most cases is less in numbers than the number of variables. Factor analysis is generally useful for linearly combining two or more variables in economic analysis.

Here is an example of factor analysis in R program:

Step I: Prepare Data

Data frame name = my_data_final


Step II: Run Factor Analysis


The analysis above showed when 13 variables were tested for five factors with varimax rotation and 0.1 cutoffs. The cutoff is taking of 0.32 to while printing to define the loadings. Factor analysis is an exploratory process in nature. If adding one more factor adds more to the cumulative variance of the model, it should keep adding. Analysis of eigenvalue also gives a basis for how many factors to use. The general principle factors having more than one eigenvalues are kept.

Step III:  Exploratory Process and Further Processing:

Further information on correlation matrix and loadings is obtained as follows. 
Use print instead of head for detail result.


Step IV: Plotting


Step V: Determining Number of Factors to Use

For this, factor having eigenvalue > 1 is considered as factor to use. Here we use 5 factors based on the eigen value from Scree Plot.


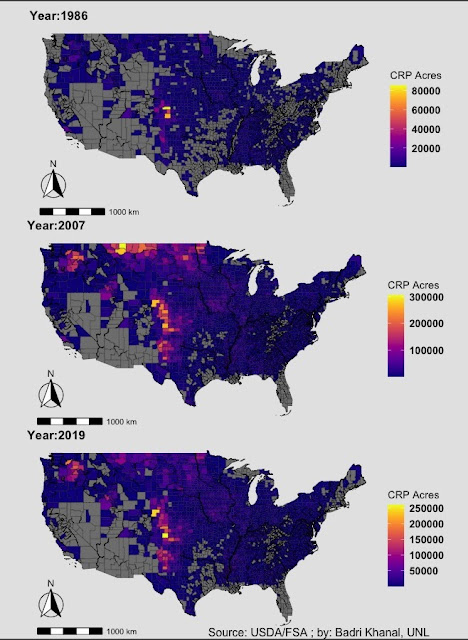
Conservation Reserve Program (CRP) Area Enrolled by County (1986, 2007, 2019)

 Conservation Reserve Program (CRP) aims to retire environmentally sensitive conventional farmland that adversely affects ecosystem services like water, soil, and biodiversity. The map shows the county-level land enrolled under the CRP for three strategic years. The first map is for 1986, the first year after the federal government started the CRP program from the Farm Bill 1985. The second map is for the year 2007, which is strategically crucial because the price of agricultural products, primarily corn, increased significantly after this because of excessive demand for bio-ethanol production. Ultimately negatively affecting the land enrollment in CRP. The third map is of 2019, the latest data available for the county level. The Farm Bill of 2018 promised to increase CRP enrollment, the effect of which has still to be analyzed.


Data Collection From Farmers: Few Housekeeping Things

I would like to share a positive experience we had with primary data collection from farmers. We collected 47 responses from farmers in a si...